1.0 INTRODUCTION
htop is a ncurses based program for viewing processes in a system running Linux. htop is quite similar to the top command. However, since htop is a newer program compared to top, it offers many improvements. htop supports mouse operation, uses color in its output and gives visual indications about processor, memory and swap usage. htop also prints full command lines for processes and allows one to scroll both vertically and horizontally for processes and command lines respectively. htop is authored by Hisham Muhammad.
2.0 INSTALLATION
On Debian based Linux systems, htop can be installed with the command,
$ sudo apt-get install htop
3.0 RUNNING htop
htop can be run from the command line,
$ htop
which, gives an output like this,
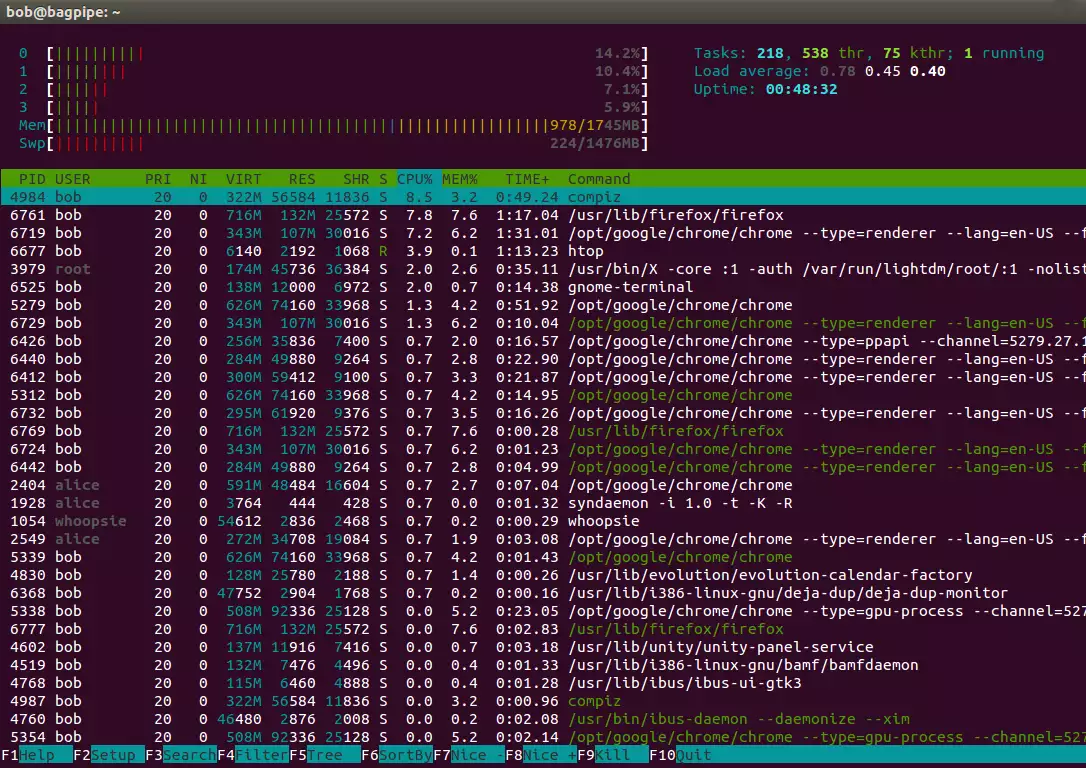
Fig. 1 htop output
Broadly, there are two parts in the output. There is a header giving summary information at the top and there is detail data below, one row per process. The header has two columns, the left and the right columns. The header has graphic meters and text counters.
4.0 CONFIGURING htop OUTPUT
4.1 DISPLAY OPTIONS
We can customize the output produced by the htop command. For the output displayed in Figure 1 above, the following display options were selected, (F2 -> Display Options)
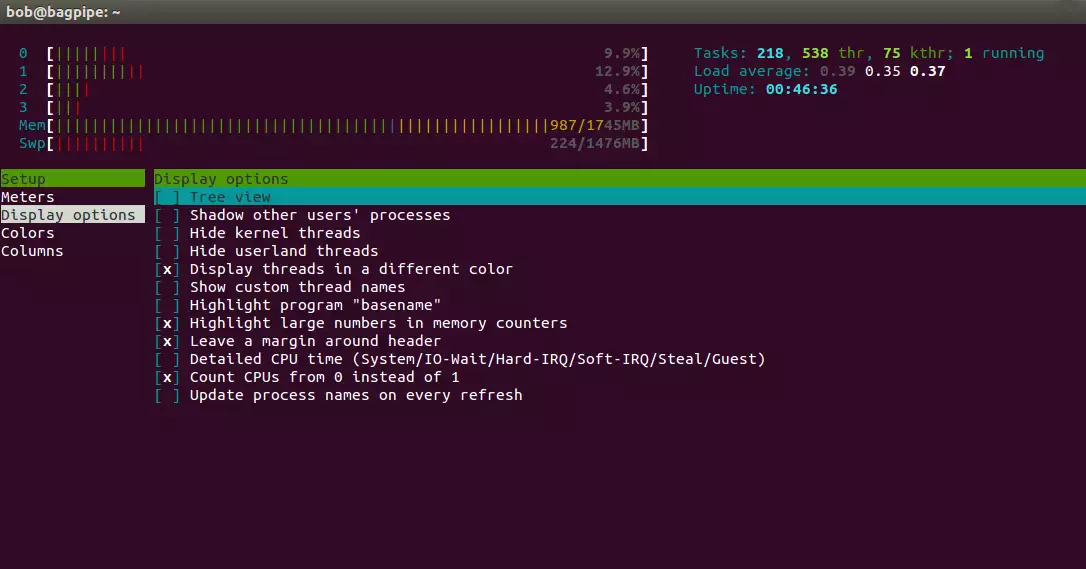
Fig. 2 htop display options
In the above display option settings, we have chosen not to hide the kernel and the userland threads. We display threads in a different color to separate them from processes, highlight large numbers in memory counters, leave a margin around the header and count CPU numbers from 0 instead of 1.
4.2 CONFIGURING METERS
Similarly, we can configure the meters, (F2 -> meters)
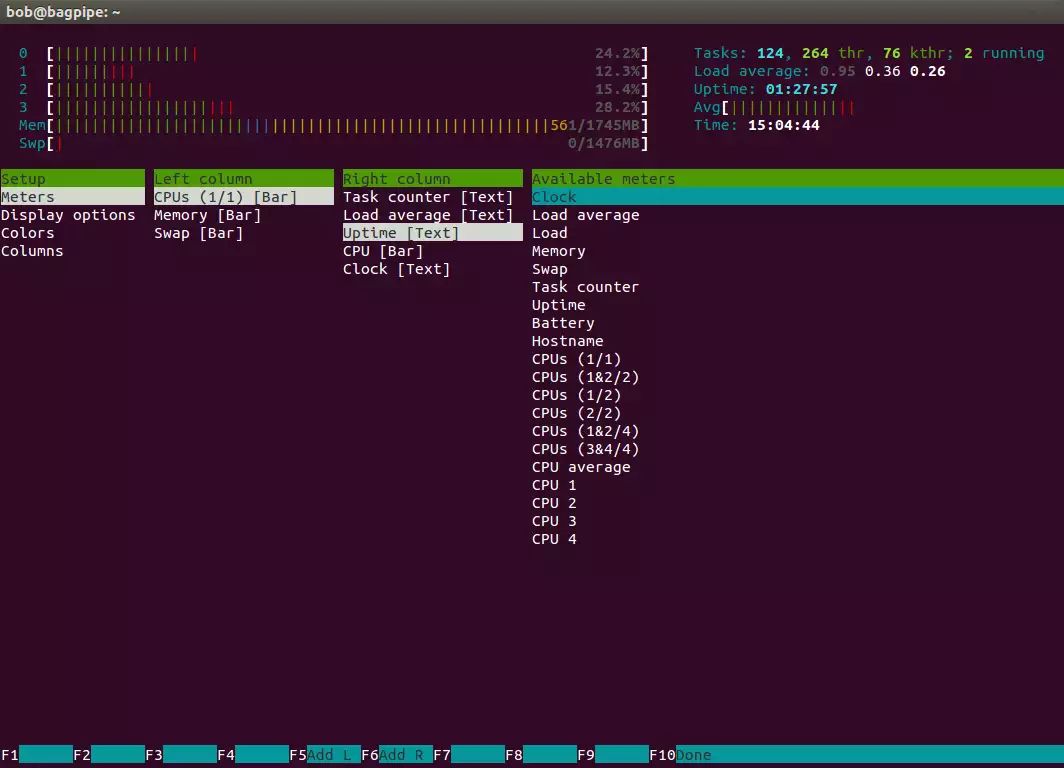
Fig. 3 htop meters' settings
The last column gives all the available meters. We have the individual CPU usage in the header left column. If we wish to put the average CPU usage in the header right column, we can select CPU average in the fourth column, click Add R (F6) at the bottom menu and have the Average CPU usage (Avg) displayed in the header right column. Similarly, we can have the Clock (Time) displayed, also, in the header right column.
4.3 COLOR CODES
The Help screen gives the color codes for CPU and memory meters. If you are running htop from a GNOME terminal, pressing F1 opens the GNOME Terminal Manual. So, to get to the htop Help screen, one has to click on the F1 Help tab at the bottom left. The Help screen gives the color codes,
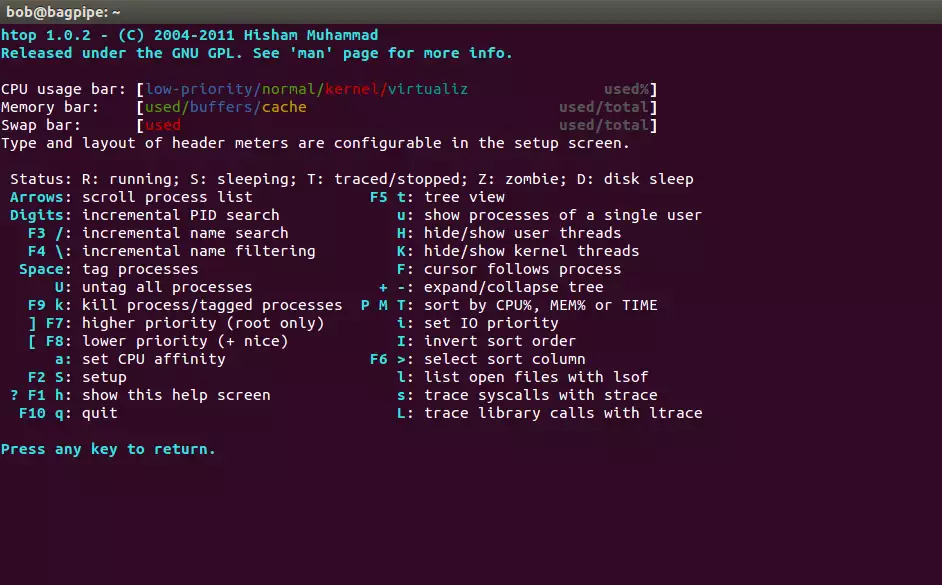
Fig. 4 htop Help screen
4.4 CONFIGURING COLUMNS
We can configure the columns displayed for processes and threads in the task area.
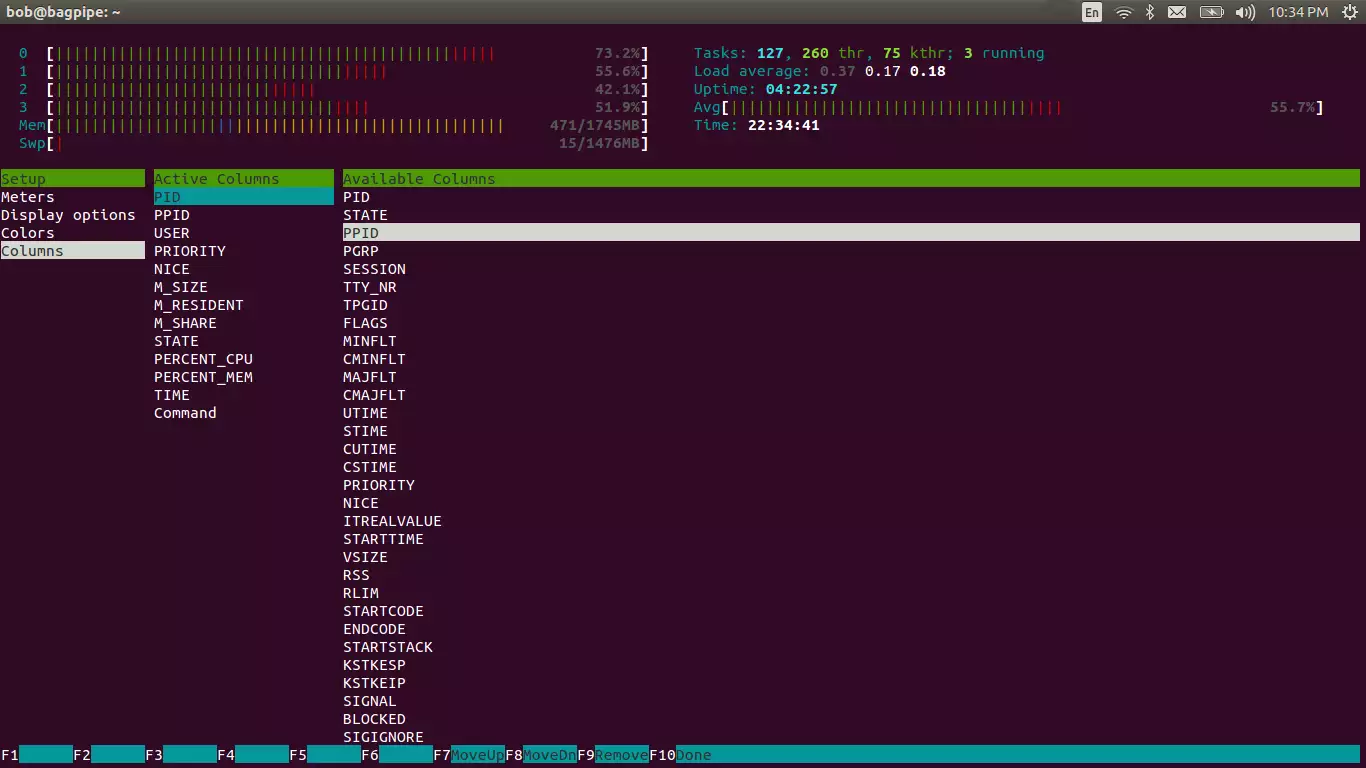
Fig. 4 htop column settings
Click F2 -> Setup -> Columns. All the currently displayed columns are displayed under Active Columns. All the available columns are displayed under Available Columns. To add a column, click on the appropriate column name in Available Columns. Click F5 -> Add. With this, the chosen column should show under Active Columns. You can adjust its place in the htop output by clicking on it in Active Columns and moving it up or down with F7 or F8 respectively. You can remove a column from Active Columns with F9. With F10, you can save the settings and return to the htop summary and process list output.
The manual (man htop) explains all the column values.
If, after extensive customization you wish to return to the initial factory settings
, remove the configuration file ~/.config/htop/htoprc.
$ rm -f ~/.config/htop/htoprc
5.0 htop commands
The process list is displayed in the task area below the header. Using the arrow keys, Page Up, Page Down, Home and End keys, we can scroll through the process list. The process under the cursor is highlighted and is the selected process. For working on multiple processes with a single command, we can tag multiple processes. The Space command is used to tag or untag a process. If we press the space bar, the process under the cursor is tagged, if it was untagged earlier, and vice versa. The command, U, untags all previously tagged processes.
The important htop commands are,
| Command | Description |
|---|---|
| Arrow keys, Page Up, Page Down, Home, End | Scroll the process list |
| Space | Tag or untag the process under the cursor |
| F1, h, ? | Help |
| F2, S | Setup |
| F3, / | Search the command lines of all the displayed processes for the keyed in string. In the search mode, pressing F3 again goes to the next match. F3 Esc exits the search. |
| F4, \ | Filter processes. Only processes with command lines having a match for the typed string will be shown. F4 Esc exits the filter. |
| F5, t | Display processes in a tree view. This works as a toggle command. Pressing F5 again gives the previous view. |
| F6, <, > | Select a new field for sorting. The selected field is highlighted in the header. |
| F7, ] | Decrement the nice value of process(es). This results in increase of process’s priority and can only be done by the superuser. |
| F8, [ | Increase the nice value of process(es). This results in a decrease in process’s priority. |
| F9, k | Kill process(es) by sending a signal chosen by the user from a menu. |
| F10, q | Quit htop. |
| I (eye) | Invert the current sort order, changing increasing to decreasing and vice versa. |
| + | In the tree view, collapse a subtree. A +is displayed to the left of the parent process. |
| a | Set CPU affinity. Mark which CPUs a process may use. |
| u | Show processes owned by a user. |
| M | Sort the process list by memory usage. |
| P | Sort the process list by processor usage. |
| T | Sort the process list by time (TIME+). |
| F | Follow. Make the selection bar follow the currently selected process as it moves up or down in the sort order. As a movement key is pressed, the process is unfollowed. |
| K | Toggle the display of kernel threads. |
| H | Toggle the display of user threads. |
| Ctrl L | Refresh the screen. |
| Number | Select the process having the entered process id. |
| s | Using strace, trace process’s system calls. |
| l (ell) | Using lsof, display open files for a process. |
| L | Using ltrace, show library calls made by a process. |
6.0 htop Command line options
The important htop command line options are given in the following table. For each argument, there is a short and a longer name, either of which can be used. If an argument needs a value, it has to be passed regardless of whether the shorter or the longer name has been used.
| Option | Description |
|---|---|
| -d –delay=DELAY | Delay between output updates, in tenths of seconds. |
| -C –no-color –no-colour |
Run htop in monochrome mode. |
| -p –pid=PID,PID… | Display output for these PIDs only. |
| -s –sort help | Print a list of column names, for which the htop output can be sorted. |
| -s –sort COLUMN | Sort the output based on COLUMN |
| -u –user=USERNAME |
Display processes for the user with this USERNAME only. |
| -v –version | Display htop version and exit. |


